Twitter Interaction Circles: An Exercise Project with NodeJS, Canvas and API
What are interaction circles on Twitter?
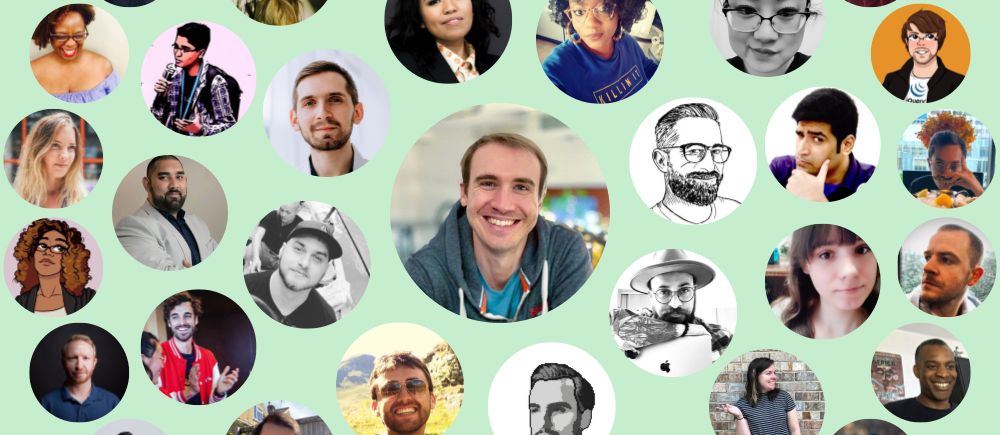
Over the last few days, images of "interaction circles" started filling Twitter feeds. They're images with avatars of the people you interact with the most on Twitter–a cute idea. The image below is made with Chirpty (my personal project), and I think it would be a great exercise for any aspiring dev to create their own!
These images seem simple, but they actually require quite a few components to get right:
- API: to fetch the data from the Twitter API to calculate the interactions
- Algorithm: to calculate the people you interact with the most and generate the circles
- Data structures: to pass data from the code modules in a logical fashion
- Image rendering: to show off our picturesque final result :D
In this tutorial, we will analyze the code used to create these images.
While this is a great project for beginners, you need a basic understanding of how Node.js and JavaScript work.
After reading this guide, you are encouraged to try your hand at reproducing this project.
How do I setup the tutorial project to create an interaction circle on Twitter?
We will use Node.js for this project. Feel free to use any language you prefer as the same result can be achieved with equal ease in Python, Java, etc.
The code for this project can be found on GitHub. You may either clone the project or read it on GitHub. The code is heavily commented and is an integral part of this tutorial. Feel free to run the code as you read along and try to debug it to understand how each step works. This project is 100% hack-friendly!
The structure of this project is very straightforward and all the code lives in the src folder, which consists of four files:
- index.js: our entry point that ties everything together
- api.js: a small library to use the Twitter API client
- data.js: processes the data extracted from the API
- image.js: code to render the image
Index.js as an entry point
Index.js is the entry point for our little application! It contains a top-level async function.
All our API calls make use of async to make the code easier to read instead of using .then().
The code is pretty clear and it's calling functions in our other modules and gluing them all together.
There are two things to note:
const layers = [8, 15, 26];
This array defines the amount of users that are in each layer. This means that the inner-most layer will have 8 avatars, the second 15 and the third 26.
await render([
    {distance: 0, count: 1, radius: 110, users: [me]},
    {distance: 200, count: layers[0], radius: 64, users: data[0]},
    {distance: 330, count: layers[1], radius: 58, users: data[1]},
    {distance: 450, count: layers[2], radius: 50, users: data[2]},
])
We will look at the render method in detail later, but for now let's look at the array that we pass to it.
Each element is made of the same properties:
- distance: from the middle of the image to the middle of the circle in the current layer. The bigger the number, the further the layer from the centre of the image
- count: circles in the current layer
- radius: of the circles in current layer
- users: list of users to render in the format
{avatar:string}
The first element of this array represents the central circle: you. The other elements contain the data for the rest of the users.
Interfacing Twitter via api.js
We will use twitter-lite as an API client to fetch the data. It's simple to use and it's arguably the most stable NodeJS twitter client out there.
Near the top of the api.js file you will find these two lines of code:
const dotenv = require("dotenv");
dotenv.config();
This sets up the dotenv library to read the .env file in the root of the project.
.env files are a great way of storing configuration values that should be kept secret. Our file contains the Twitter API keys.
If you would like to run this project, make sure you have these keys by creating a new application on the Twitter Developer Portal.
The api.js file contains a series of functions to interact with the Twitter client.
The exported functions from this module are:
getMe: gets the current user's profile; we only need the avatar URLgetLiked: returns an array of liked posts by the usergetTimeline: returns an array of posts by the user, including replies and retweetsgetAvatars: takes a list of user IDs and returns them with an associated avatar URL
getLiked and getTimeline have corresponding getLikedPage and getTimelinePage because each API call can return up to 200 results, but the API allows fetching up to 3000 entries; therefore, we need to paginate.
How is pagination implemented in the API?
let timeline = [...posts];
while (posts.length > 0 ) {
    timeline = [...timeline, ...posts];
    const max_id = "" + (BigInt(posts[posts.length - 1].id_str) - 1n);
    posts = await getTimelinePage(screen_name, page++, max_id);
}
Pagination in the API is achieved by setting the max_id in the request parameters. This means that all the entries returned
will be dated before that post ID. After fetching a page, we append it to a result array and then we use the last entry of the array as a new max_id
The way we calculate the max_id appears complex because the post IDs are strings representing BigInts and to subtract 1 we need to first convert and then re-convert it back to a string.
Hacking avatar sizes
The avatar URLs returned by the API all look like this:
https://pbs.twimg.com/profile_images/1238524036965113861/nqDXDS5l_normal.jpg
That last part _normal means the image will be 48x48, which is too small for our purposes, so replace it with _400x400
user.profile_image_url_https.replace("normal", "400x400")
Hacker Tip: The official Twitter documentation doesn't mention the 400x400 images, but you can find them by inspecting the Twitter Web Client.
The algorithim to count your interactions: data.js
Now that we have a general idea of how we'll get data out of the API, we need to decide how we are going to represent interactions.
For the purpose of this project we will consider an interaction as when the user likes/responds/retweets a post.
We will not count when other users interact with us.
We will assign a value to each of these actions because a retweet is arguably a greater sign of interaction than a like.
- Like: 1.0
- Reply: 1.1
- Retweet: 1.3
These values are completely arbitrary and you can change them to whatever makes sense to you.
The data.js file has only one default exported function. This function takes a screen_name which is our Twitter username and the layers array from the index.js.
This function is the main logical part of the application where we decide what we will represent, so let's take a deeper look at it.
const timeline = await getTimeline(screen_name);
const liked = await getLiked(screen_name);
Here we use our api.js to fetch the whole timeline and liked posts.
const interactions = {};
This is the declaration of the variable in which we are going to keep our data as we process it.
It's an object where the key is the user_id and the values are objects like this:
{
    screen_name: string,
    id: string,
    reply: number,
    retweet: number,
    like: number,
}
Counting interactions from the API data
countReplies(interactions, timeline, screen_name);
countRetweets(interactions, timeline, screen_name);
countLikes(interactions, liked, screen_name);
These three functions work in a similar way: They take a list of posts (either the timeline or the liked) and for each post, they check if it's an interaction.
If it is indeed an interaction, it adds it to our interactions object for the correct user.
Tallying the interactions into the final data model
const tally = [];
for (const [key, interaction] of Object.entries(interactions)) {
    let total = 0;
    total += interaction.like;
    total += interaction.reply * 1.1;
    total += interaction.retweet * 1.3;

    tally.push({
        id: interaction.id,
        screen_name: interaction.screen_name,
        total,
    });
}
Here we incorporate the main logic of our algorithm; we iterate over all the user interactions we recorded, count the total value and add the result to a tally array.
tally.sort((a, b) => b.total - a.total);
Then, we sort the array by the total property.
const maxCount = layers.reduce((total, current) => total+current, 0);
const head = tally.slice(0, maxCount);
Our tally array might have hundreds of users in it and we need to fetch the avatars of the users we want to display. Therefore, we need to limit it to the amount of users we actually need.
The reduce function is scary for beginners but we are only calculating the sum of the values in the layers array. It's the same as doing 8+15+26.
We then slice tally between 0 and maxCount, storing the resulting array in head
const ids = head.map((u) => u.id);
const avatars = await getAvatars(ids);
for (const i of head) {
    i.avatar = avatars[i.id];
}
Convert our head from an array of object to an array of IDs that we can easily pass to our API. Then, we add
a property to each of our head objects with the corresponding avatar.
const result = [];
result.push(head.splice(0, layers[0]));
result.push(head.splice(0, layers[1]));
result.push(head.splice(0, layers[2]));
return result;
This is the last part of the algorithm! Break our head array into 3 separate arrays, each respectively 8, 15 and 26 items.
The splice method deletes the elements from the array it is called on and returns them in a new array.
Drawing data on the canvas to make the final image
To draw our image we use the render method with the configuration we saw at the beginning of the tutorial and now we know what goes in the users property.
The rendering of our image will happen with the help of the node-canvas API, which is a port of the web canvas API.
The canvas API is a complex topic on which entire books can be written, so I will stick to explaing the actual draw logic rather than the API.
If you would like to learn more about the canvas API you can start off with the MDN.
The main part of the rendering happens inside a nested loop:
for (const [layerIndex, layer] of config.entries()) {
    const {count, radius, distance, users} = layer;
    const angleSize = 360 / count;
First, we iterate over each layer of the config, then we destructure the layer to get the variables we need.
angleSize is the size of a slice of the current layer in degrees, e.g. the first layer has 8 users, 360 / 8 = 45. This is needed to calculate the position of each avatar on the current layer.
for (let i = 0; i < count; i++) {
    const r = toRad(i * angleSize + layerIndex * 30);
Then we iterate over each user of the current layer. i * angleSize gives us the angle at which our avatar should go, and then we add layerIndex * 30 to it–only so that each layer is a bit "off."
const centerX = Math.cos(r) * distance + width / 2;
const centerY = Math.sin(r) * distance + height / 2;
These two variables indicate the position on the cartesian plane of the image where the avatar will end up being. We need to add half of the image size because we are starting at the center of the image.
ctx.save();
ctx.beginPath();
ctx.arc(centerX, centerY, radius, 0, 2 * Math.PI);
ctx.clip();
This code is basically setting up a clip for our avatar to go in. Avatars are sqaure; we want a nice circle.
To render a circle, we need to render a clip with the shape we want, and then render the image.
The canvas API will merge the two, effectively clipping our image to the shape we rendered first.
const img = await loadImage(users[i].avatar);
ctx.drawImage(
    img,
    centerX - radius,
    centerY - radius,
    radius * 2,
    radius * 2
);
We load the image from the avatar URL and then we draw it under the clip. We use the radius of the circle as the size of the avatar's frame.
const out = fs.createWriteStream("./circle.png");
const stream = canvas.createPNGStream();
stream.pipe(out);
out.on("finish", () => console.log("Done!"));
This is the final part of the application! It takes our canvas and streams it to a file in PNG.
You are done!
Conclusion and bonus coding challenges
Making this project was a blast! There is a lot to learn, and you get to create something fun.
To test your knowledge, you can try to rewrite the whole project or try to apply the following modifications to the code:
- Apply a shade to each avatar based on the most common type of interaction
- Fetch the circles for another user
- Render a grid instead of the circles
- Change the algorithm!
Fork the repository and share your results with me on Twitter!